Multi-Tenant Analytics Dashboard
Full-stack analytics dashboard with auth, role-based access, Clicky & Google Search Console integrations, and Cloudflare Workers. One app to track many sites.
Multi-Tenant Analytics Dashboard
TL;DR for Founders
I built a production-ready analytics dashboard that puts web traffic, search console, and (planned) social metrics in one view-for website owners, marketers, and agencies who want clear insights without juggling tools. This case study shows how I approach product problems, make architectural trade-offs, and deliver working systems quickly.
The Problem
Website owners and marketers need visibility into traffic, SEO performance, and social signals to make informed growth decisions.
The typical setup means switching between:
- Google Analytics or Clicky for traffic
- Google Search Console for search performance
- Multiple social platforms for engagement metrics
- Separate tools for each client or project
This fragmentation makes it hard to:
- See the full picture of website performance
- Spot patterns across traffic, search, and social
- Make quick decisions without context-switching
- Share access with clients or team members cleanly
Why This Matters to the Business
- Fragmented data slows down decision-making
- Context-switching wastes time and creates blind spots
- Giving clients access means sharing logins or building custom reports
- Growth marketing requires seeing traffic, SEO, and social together
Why I Built This
I was switching between Clicky, Google Search Console, and social dashboards to check performance for my own sites and client work. No single place to see traffic, content, and sources together.
I built this as a realistic product exercise: one dashboard that pulls traffic stats (currently Clicky and Google Search Console, with social metrics planned), displays them clearly, and handles multi-project access properly - so you can track multiple sites without switching accounts or tools.
The goal was to ship something usable quickly, treating it like a real client engagement: define scope, make trade-offs, and decide what not to build.
What the System Does
The dashboard provides one place for traffic, content, and access:
- Web traffic analytics - Visitors, pageviews, bounce rate, time on site, with period-over-period comparison. See today, 7 days, 30 days, 90 days, or custom ranges.
- Content insights - Top pages by traffic, landing pages, exit pages. Understand what’s driving visits and where users drop off.
- Audience breakdown - Countries, browsers, operating systems, engagement patterns. Know who’s visiting and how they interact.
- Traffic sources - Referrers, search engines, campaigns. See where your traffic comes from and optimize accordingly.
- Google Search Console data - (Work In Progress) Search queries, impressions, clicks, positions. Track SEO performance alongside traffic.
- Multi-project support - Track multiple websites in one app. Each project has its own metrics; users only see projects they’re assigned to. Agencies and freelancers can manage client sites without separate logins.
- Clean access control - Invite team members or clients, assign them to specific projects, and give them view-only or admin access. No shared logins.
What This Enables
- One place for metrics - See all website metrics in one place without juggling tools
- Faster decisions - Make growth marketing decisions faster with complete context
- Quick onboarding - Onboard new sites (yours or clients’) in minutes
- Clean sharing - Share access cleanly without exposing credentials or other projects
Planned: Social Metrics
Next phase adds Twitter, LinkedIn, and other social platforms so you can see:
- Social alongside traffic - Social engagement (likes, shares, comments) alongside traffic
- Content signals - Which content drives social signals and referrals
- Full-funnel view - Social → traffic → conversions
Architecture Overview
The system is built around a simple principle: clear boundaries over clever abstractions.
At a high level:
- Multi-project data isolation - Projects are isolated at the data layer. Each website is a “project” with its own metrics; users only see projects they’re assigned to. Admins get full access; regular users see only their assigned projects.
- Centralized data aggregation - A single edge API fetches data from Clicky, Google Search Console, and (planned) social APIs, stores it in Postgres, and serves it to the UI. The front end never touches external APIs or credentials.
- Access rules enforced consistently - Front end, database queries, and the API all use the same rule: users only see data for projects they’re allowed to access. Invalid project URLs redirect to a valid project instead of showing “no access.”
Design Trade-offs
- Chose simplicity over real-time - Batch refresh (on-demand + cron) instead of real-time streaming. Predictable, easy to debug, and sufficient for daily/weekly traffic analysis.
- Stored data over live queries - Fetch from external APIs, store in Postgres, serve from the database. This keeps the UI fast even if external APIs are slow or down, and makes period-over-period comparison straightforward.
- Explicit scoping over clever abstraction - Tenant isolation via explicit “assigned projects” logic everywhere. Easy to test, reason about, and extend.
These choices were intentional - ship usable without creating future debt.
What I Built
I delivered the full system end to end: from database and auth to the live dashboard and deployment. Here’s what’s in place:
- Backend architecture and data modeling - Supabase (Auth + Postgres): profiles, projects, project assignments, metrics tables, refresh and audit logs. No API keys in the database; only non-secret identifiers (e.g. Clicky site ID, GSC property).
- Access control and multi-project support - Role-based access (admin/user), project assignment, protected routes. Non-admins see only assigned projects; admins see everything.
- Analytics aggregation - Cloudflare Worker handles on-demand and scheduled refresh: fetches from Clicky and GSC, stores in Postgres, serves to the UI. Front end never touches external APIs.
- Frontend dashboard UI - React SPA: date ranges (Today, 7d, 30d, 90d, Custom), line charts, tabs (Dashboard / Content / Audience / Traffic Sources), insights panel with 7-day and 30-day comparison, refresh with cooldown, skeletons and empty states.
- Deployment-ready structure - Cloudflare Pages (app), Workers (API + cron), Supabase (auth + DB). Secrets in Worker KV so database backups stay safe.
Solo build, short timeframe - focused on shipping a working system rather than chasing completeness.
Screens and Views
Here’s what users see when they use the dashboard:
- Dashboard home - Grid of project cards with 7-day visitors and pageviews. Quick access to all projects you manage.
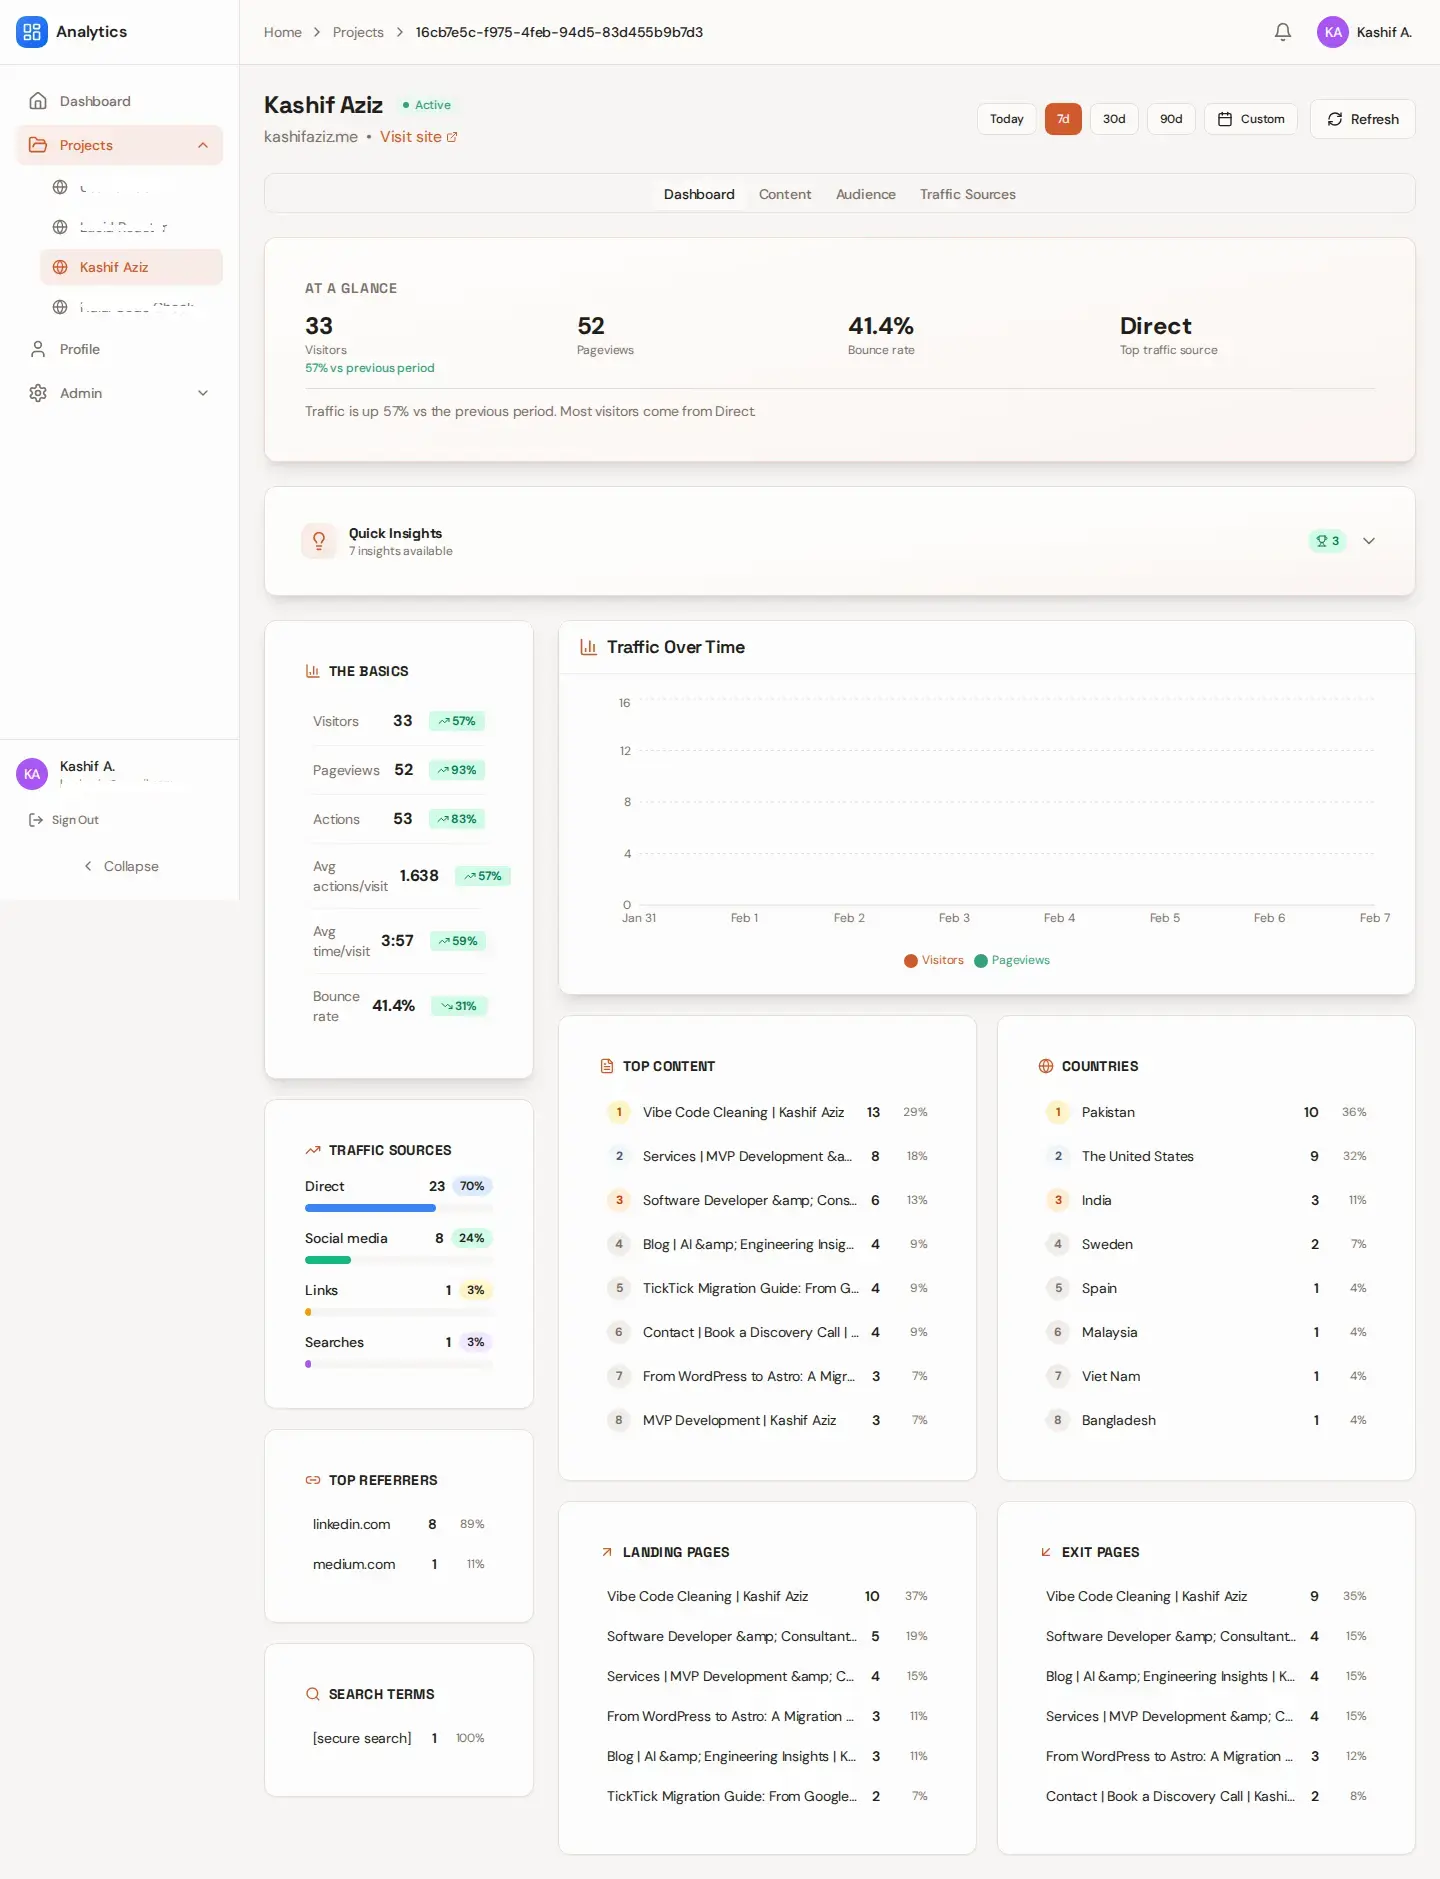
- Project detail - Traffic overview (visitors, pageviews, bounce rate, time on site), period-over-period comparison, date range picker, line charts.
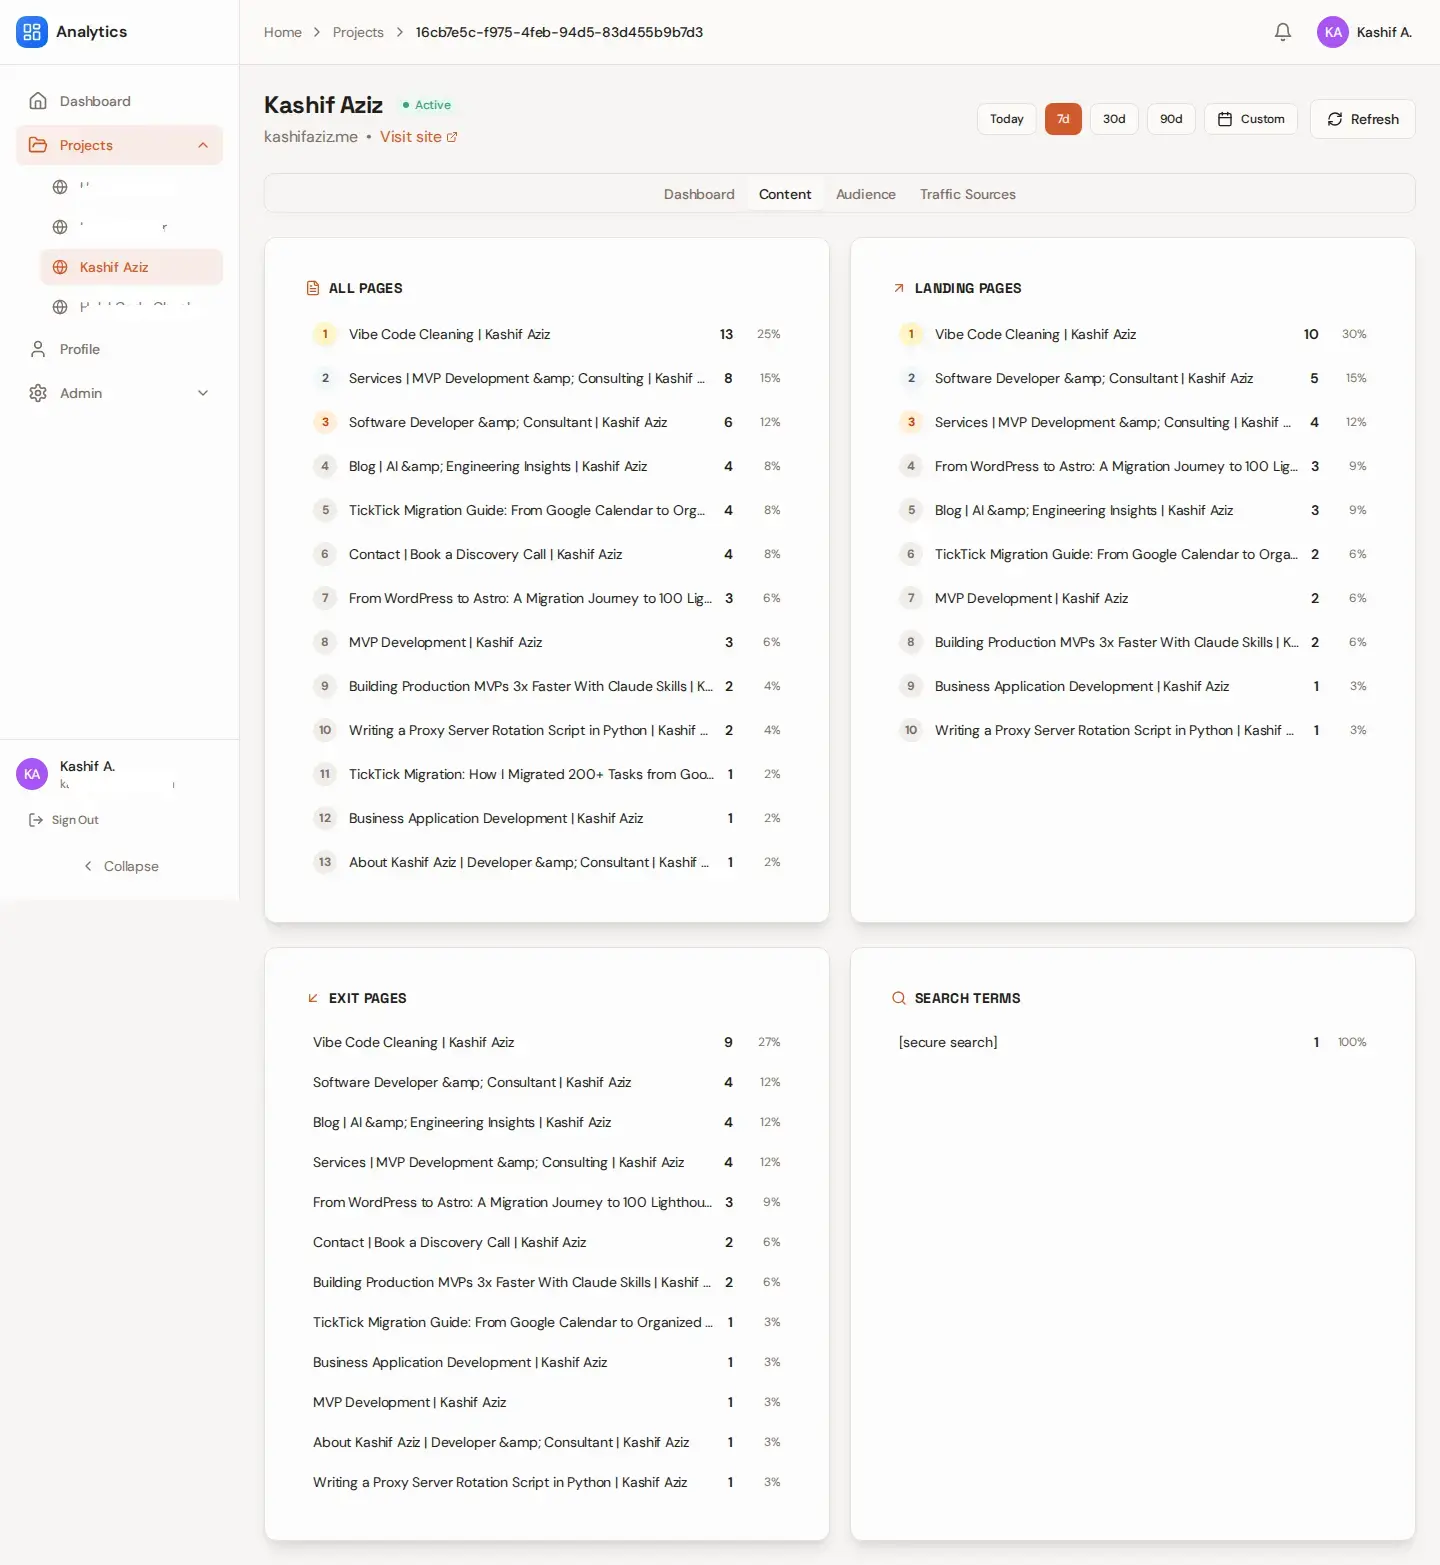
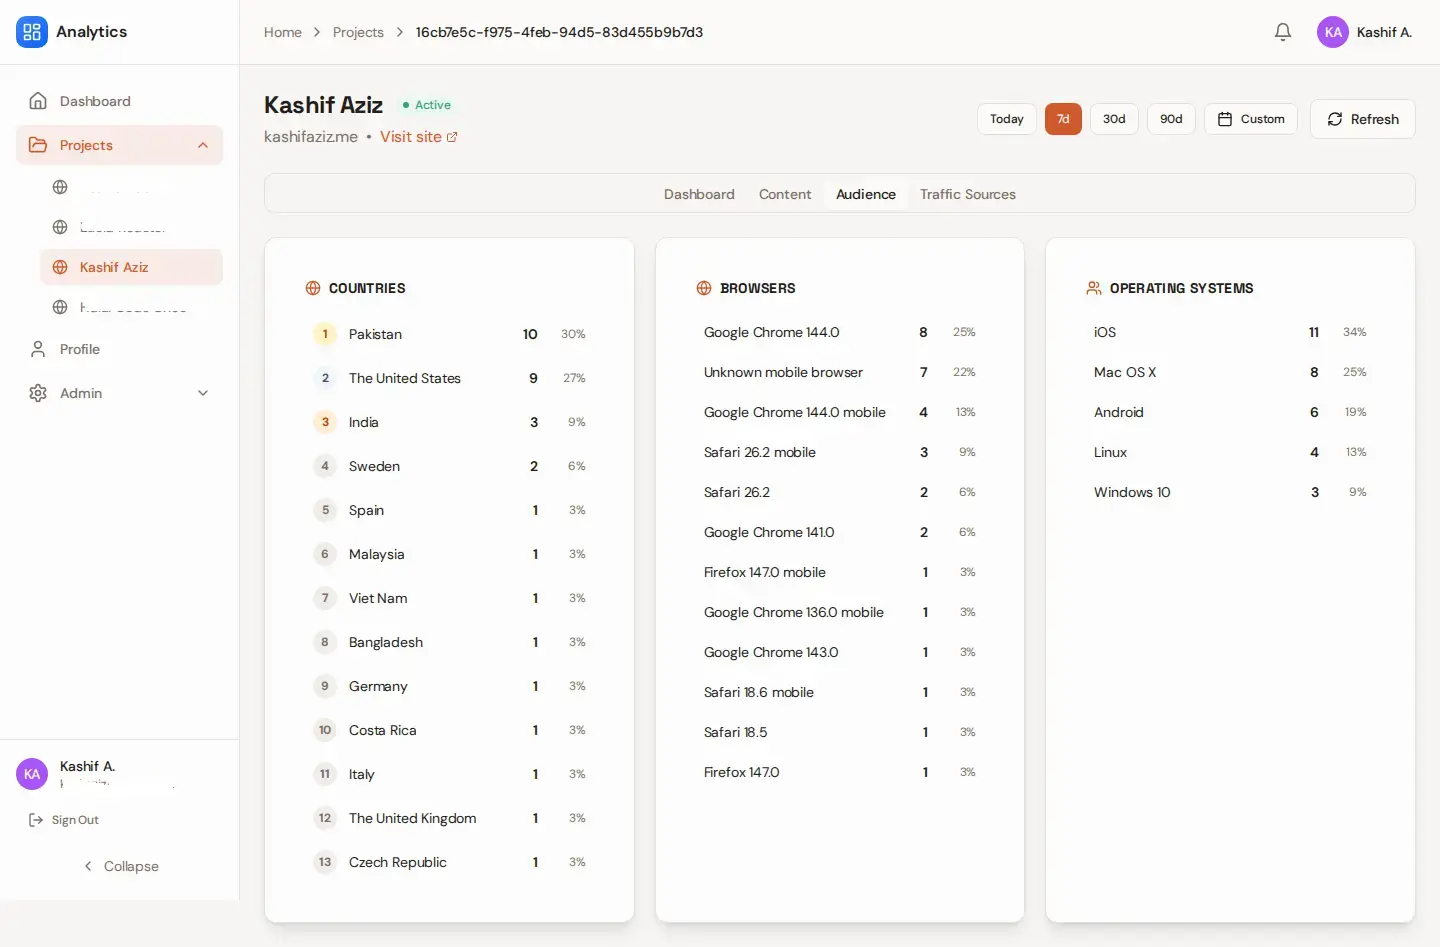
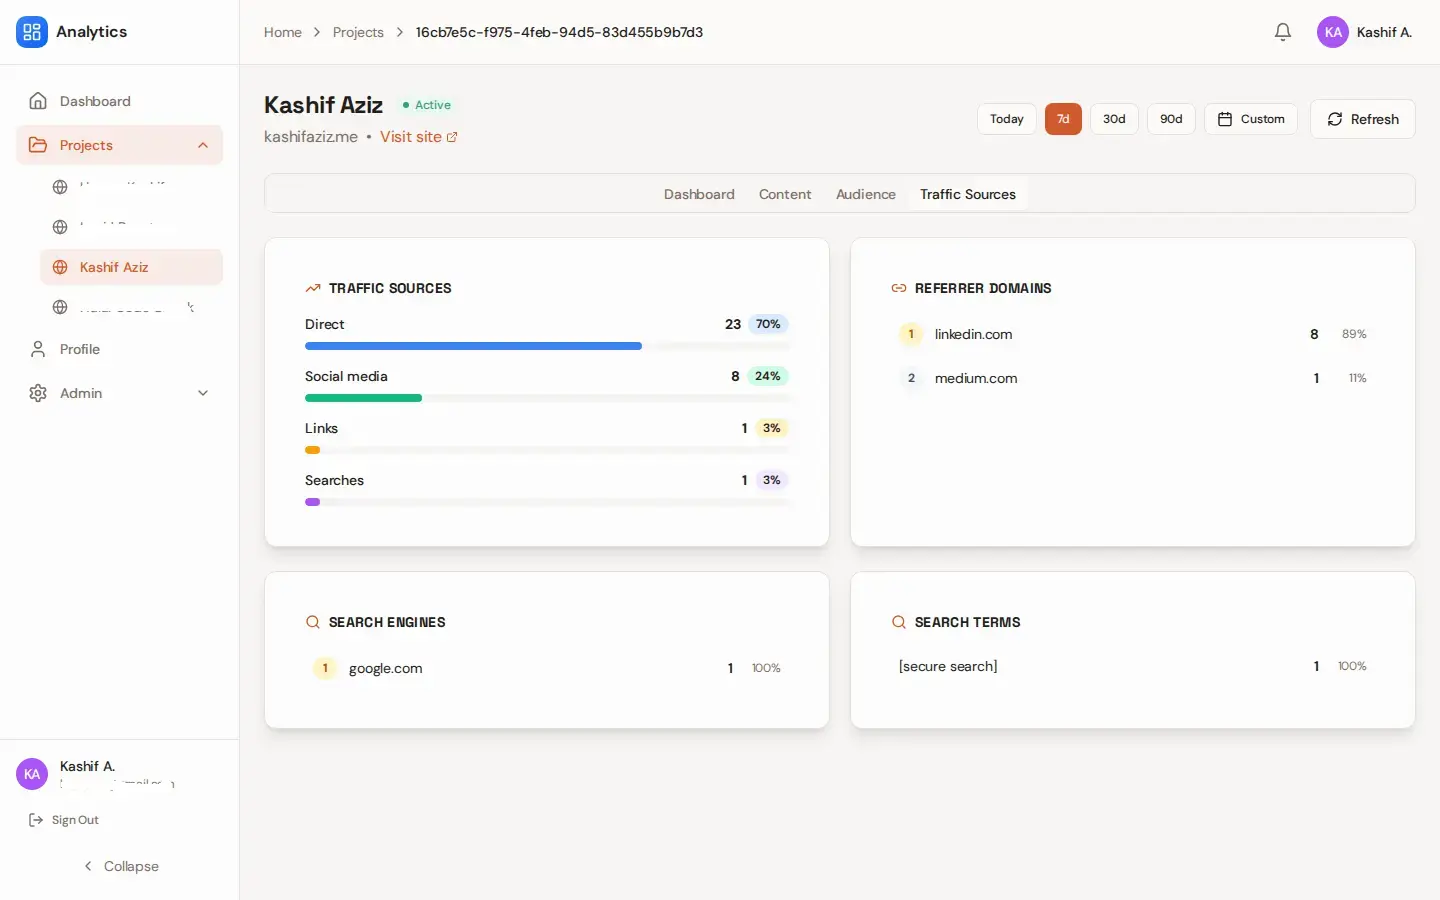
- Content, Audience, Traffic Sources - Tabs in the same view: top pages, landing/exit pages; countries, browsers, OS; referrers, search engines, campaigns.
- Insights panel - Plain-language takeaways (“Traffic up 15% this week”, “Bounce rate improved”) from 7-day and 30-day windows.
- Admin panel - Create/edit projects, set Clicky key, list users, invite via magic link, assign projects, view audit and refresh logs.
Main project view
Traffic overview, date range, and line charts:
Content, Audience, and Traffic Sources
Technical Decisions
Key decisions were driven by one goal: deliver fast without locking the system into bad choices.
- Cloudflare Worker instead of a long-lived server - External API calls (Clicky, GSC) and credentials stay in an edge Worker; the client and database never touch them. Same Worker handles on-demand refresh and cron, so one implementation for both. Tradeoff: Worker CPU and KV limits; for current project count and refresh frequency, well within bounds.
- Secrets in Worker KV, not Postgres - Clicky keys stored in Worker KV, keyed by project. Database holds only public identifiers (site ID, GSC property). A leaked DB backup doesn’t leak API keys. Tradeoff: key management is manual (admin form → Worker → KV); acceptable at this scale.
- Fixed periods for insights - Insight copy (“Traffic up 15% this week”) uses fixed 7-day and 30-day windows, not the user’s selected chart range. Wording stays stable and cacheable. Tradeoff: insights don’t reflect the exact range on screen; that’s intentional to avoid confusing copy that changes meaning.
- Assigned-projects everywhere - One rule for all non-admin data: only assigned projects. Sidebar, home, and detail view all use it; admins get all projects via assignment. No path for a non-admin to see another project’s data.
This keeps the system easy to extend as requirements evolve - e.g. adding social metrics is a new data source with the same access and display patterns.
What I’d Improve Next
If this were taken further, the next steps would include:
- Social metrics integration - Twitter, LinkedIn, Facebook engagement and follower data alongside traffic
- Performance optimizations for larger datasets and longer date ranges
- More granular permissions - View-only, edit, manage users per project
- Alerting and anomaly detection - Notify when traffic drops or spikes unexpectedly
- Additional UX polish - Based on usage patterns
I intentionally stopped short of these to avoid over-building before real feedback.
Tech Stack
The stack was chosen to balance speed, familiarity, and long-term maintainability.
| Layer | Choices |
|---|---|
| Frontend | React 18, TypeScript, Vite, shadcn/ui, Tailwind, Recharts, React Query, Framer Motion, React Hook Form, Zod |
| Backend / DB | Supabase (Auth, Postgres) |
| API / Cron | Cloudflare Workers (Hono), KV for Clicky keys |
| Integrations | Clicky API, Google Search Console API, (Planned) Social APIs |
| Deploy | Cloudflare Pages (app), Cloudflare Workers (API), Supabase (auth + DB) |
Each tool was selected based on how quickly it allowed progress without sacrificing clarity or control.
Final Thoughts
This project reflects how I approach real-world consulting work:
- Start from the business problem - Not the technology
- Design with intent - Every decision is documented and strategic
- Ship pragmatically - Fast delivery without technical debt
- Leave room to grow - Architecture scales without refactoring
If you’re a founder or product owner looking for someone who can take vague requirements and turn them into working systems-quickly and responsibly-let’s talk. Want to discuss a similar project? Get in touch.
I specialize in:
- Rapid MVP development - 8-18 hour delivery timeframes
- Multi-tenant SaaS architecture - Secure, scalable from day one
- AI-powered automation - Eliminating manual workflows
- Production-grade code refactoring - Taking AI-generated code to production quality
Interested in building something similar?
I help founders ship privacy-conscious, production-ready products fast, from idea to deployed experience.