Inside My Claude Code Workflow: What the Insights Report Revealed
Claude Code's /insights report showed where to optimize. What it showed (single-goal vs multi-task, friction points), what it recommended (hooks, task agents), and what I'm doing. Takeaways: CLAUDE.md, skills, run your own report.
Claude Code tracks everything. Every message, every file touched, every tool called, every session outcome. And after 6 weeks of intensive use, it generated something I didn’t expect: a detailed usage report that showed me exactly how I work, and where I was leaving productivity on the table.
The data was fascinating. But more importantly, it was actionable. The report didn’t just show me what I did; it identified patterns, highlighted friction points, and suggested specific features I wasn’t using that could eliminate my biggest bottlenecks.
This isn’t a post about AI replacing developers. It’s about using data to understand your own workflow, identify waste, and systematically improve. The insights from this report are what I’m now using to improve my Claude session success rate.
Here’s what the report showed, and how you can use the same approach to optimize your own Claude Code workflow.
TL;DR
The discovery: Claude Code’s usage insights revealed my exact workflow patterns, friction points, and optimization opportunities across 50 sessions.
What the report showed:
- Single-goal sessions had 80% success vs 18.75% for multi-task sessions
- 47 “buggy code” friction events: Claude declaring work complete without testing
- 42 “wrong approach” events: Claude suggesting tools/infrastructure I don’t use
Who this is for: Developers using Claude Code (or any AI coding assistant) who want data-driven insights into their own workflow patterns.
1. What the Claude Code report showed
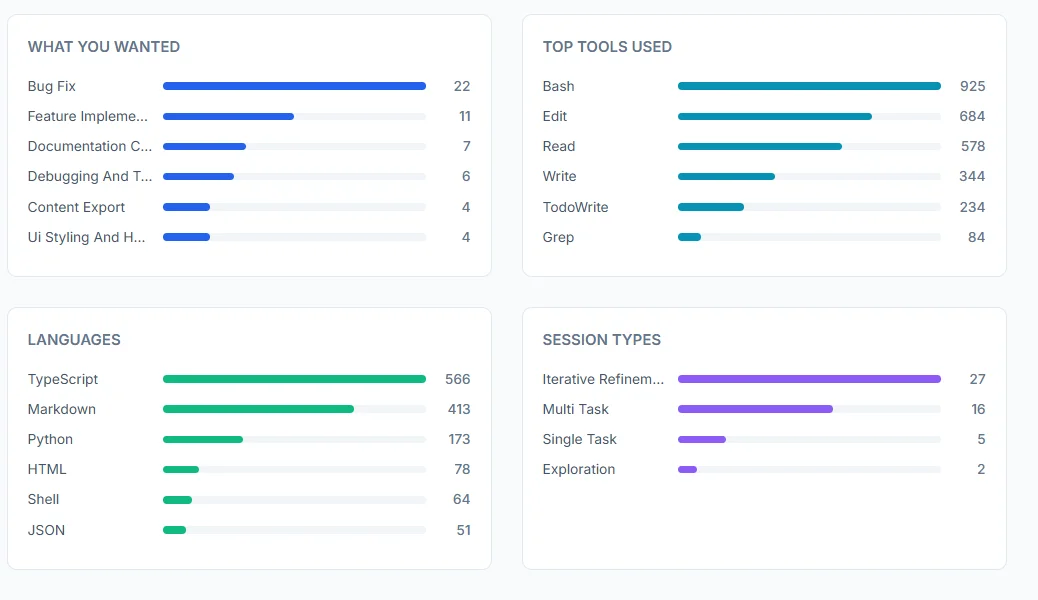
Claude Code’s /insights report breaks down everything. Here are the highlights from 50 sessions.
Usage snapshot
Session distribution:
- 54% Iterative Refinement (going back and forth on bugs)
- 32% Multi-Task (trying to do multiple things at once)
- 10% Single-Task (one focused goal)
- 4% Exploration (pure research)
Outcomes and success rates
Session outcomes:
- ✅ Fully Achieved: 26%
- ⚠️ Mostly Achieved: 34%
- 🟡 Partially Achieved: 32%
- ❌ Not Achieved: 8%
Top friction points
- Buggy code (47 instances): Claude declaring work complete without actually running verification (build/tests).
- Wrong approach (42 instances): Claude suggesting tools or infrastructure I don’t use unless I anchor it to my stack.
What helped most: Multi-file changes
The usage report revealed something I wasn’t expecting:
“Multi-file Changes” was Claude’s top capability (26 instances)
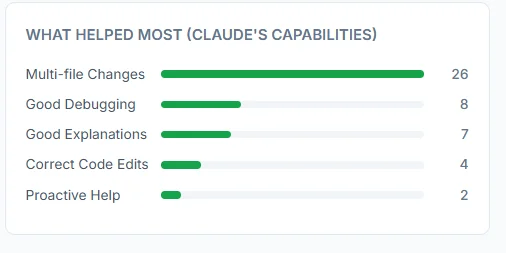
This was actually a positive pattern. When sessions worked well, they involved coordinated changes across multiple files:
- Refactoring component structure (3-5 files)
- Adding features with tests (2-4 files)
- Updating infrastructure config (deployment + CI + docs)
The key insight: AI assistants excel at multi-file refactoring when the goal is clear and atomic.
2. What the report recommended
The insights report didn’t just diagnose patterns - it recommended product features that reduce the two biggest failure modes (buggy code + wrong approach).
Hooks (auto-run verification after edits)
The idea: Automatically run build/test checks when Claude edits code.
// .claude/settings.json
{
  "hooks": {
    "postEdit": {
      "command": "npx tsc --noEmit 2>&1 | head -20",
      "description": "Type-check after edits"
    }
  }
}
Why this matters: My biggest friction source was buggy code. A post-edit hook that auto-runs type-checking would catch build breaks instantly before Claude moves to the next file.
Task agents (parallel investigation)
The idea: Spawn focused sub-agents for exploratory work while your main session continues.
Example:
"Spawn a task agent to investigate the MDX rendering issue -
check version compatibility, component passing, and provider support -
while you continue fixing the CSS layout separately."
When to use:
- Complex debugging requiring systematic investigation
- Parallel research (API alternatives, library comparisons)
- Exploratory refactoring
On the horizon
The report also included a “horizon” section - three capability directions stood out:
- Autonomous bug-fix loops: write a failing test, attempt a fix, rerun, and iterate until green (without hand-holding).
- Parallel agents: multiple agents working concurrently on independent workstreams of a larger task.
- Checkpoint-driven development: validate immediately after each functional change to prevent “declared complete but broken.”
3. What I’m doing about it
Based on the findings above, I’m standardizing three habits:
- Single-goal sessions: one deliverable, stop after it’s verified.
- Verification-first: no “done” until the build/tests pass.
- Stack anchoring: start by reading
CLAUDE.md,.env, andpackage.jsonso recommendations match reality.
Here’s the single prompt pattern I use most often now:
Implement [feature].

Before declaring done:
1. Run build - show output
2. Run tests - show results
3. Fix any errors
4. Only report completion when everything passes

Do not skip verification.
If you want one practical next step: open your /insights report, identify your top friction category, and run your next session with one goal plus explicit verification.
Actionable takeaways
1. Build meta-workflows (so Claude stops repeating mistakes)
The report made it obvious that a lot of friction is systemic: the same context gaps and verification misses happen across sessions. The fastest fix is to turn your preferences into reusable defaults.
- Create small skills for repeated workflows (deploy, migrations, content publishing). For a full example, see Building production MVPs with Claude skills.
- Codify your stack + constraints in
CLAUDE.mdso recommendations match reality.
Two CLAUDE.md files: Use a global file for preferences that apply everywhere, and a project file for repo-specific details. Claude reads both: global first ~/.claude/CLAUDE.md, then project ./CLAUDE.md in each repo. That way you document “use Wrangler, verify builds” once globally, and only add stack/commands per project.
Example skill (keep it short and specific):
# .claude/skills/deploy/SKILL.md

1. Run `npm run build` and confirm zero errors
2. Deploy using wrangler (no API tokens)
3. Verify production responds with 200
Example CLAUDE.md rules (the stuff you wish you didn’t have to repeat):
## Verification
After code changes, always run the build and show output.

## Deployment
Use Wrangler CLI. Do not suggest API tokens.
2. Turn recommendations into defaults (Hooks)
Hooks are the most direct response to the report’s biggest friction category (buggy code). Set them up in .claude/settings.json (see the Hooks example above) so verification runs automatically right after edits.
3. Use your report like a feedback loop
- Pick one friction category to improve this week (buggy code vs wrong approach).
- Change one thing (single-goal sessions, stronger verification, better stack anchoring).
- Re-check
/insightsafter a week and see what moved.
To generate (or refresh) the report, run /insights inside Claude Code, then open the HTML output at:
xdg-open ~/.claude/usage-data/report.htmlResources
- Run Insights: In Claude Code, run
/insightsto generate/refresh the report - Usage Report:
~/.claude/usage-data/report.html - Claude Skills: GitHub
- Documentation: Claude Code Docs
- Example skills: Building production MVPs with Claude skills
Go check your usage report. What’s your success rate? What patterns emerge? What’s blocking you?
Run /insights, pick one friction to fix, and let the next report confirm the improvement.
I write about AI-assisted dev and building faster. X · LinkedIn · Work with me.
Tags:
Want help applying this to your product?
If this post matches what you are building, I can help you execute it with clear scope and delivery.